
Esta entrada está disponible solo en inglés.
The gap that doesn't move
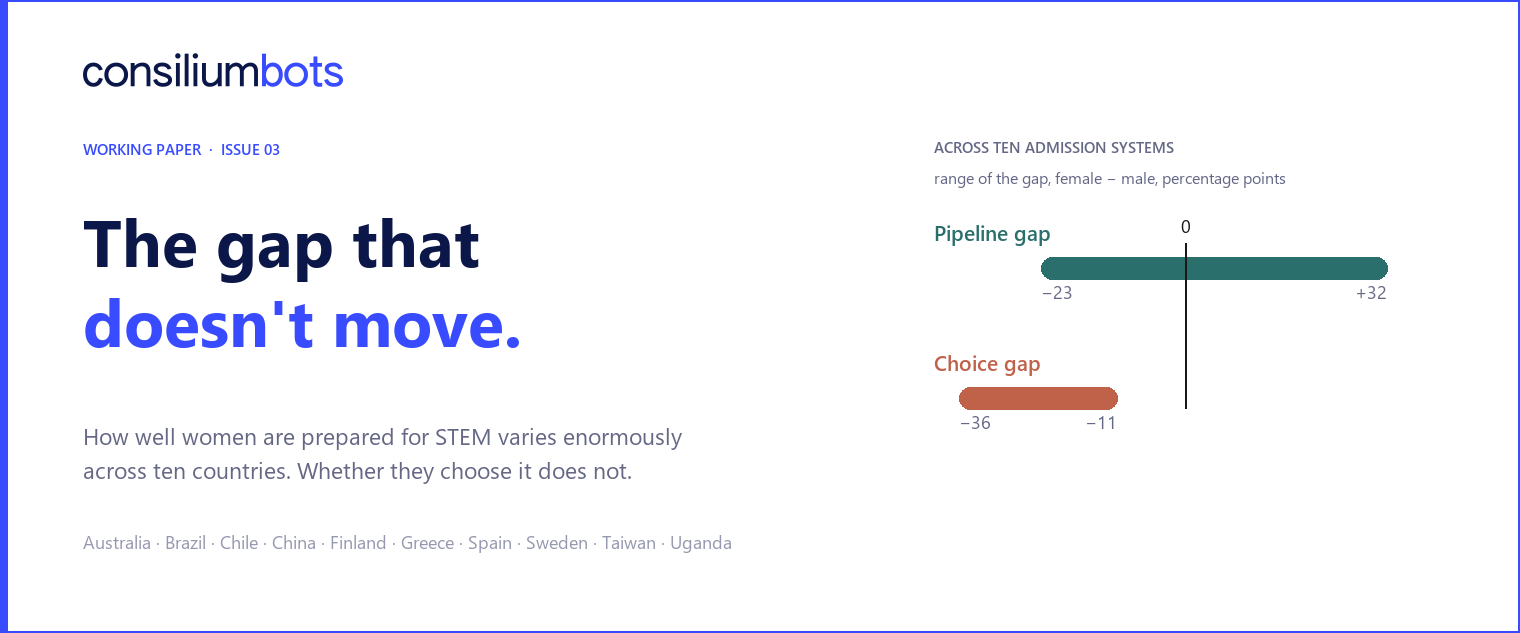
Across ten centralized admission systems on five continents, how well women are prepared for STEM varies enormously. Whether high-achieving women rank a STEM program first barely varies at all.
Source: The Global Gender Gap in STEM Applications: Pipeline vs. Choice, by Isaac Ahimbisibwe, Adam Altmejd, Georgy Artemov, Andrés Barrios-Fernández, Aspasia Bizopoulou, Martti Kaila, Jin-Tan Liu, Rigissa Megalokonomou, José Montalbán, Christopher Neilson, Sebastián Otero, Jintao Sun and Xiaoyang Ye. ConsiliumBots Working Papers no. 03. Figures reproduced from the paper.
In Sweden, women are two-thirds of the country’s strongest school-leavers. Among those same top performers, fewer than one in five ranks a STEM program — science, technology, engineering or mathematics — first on her university application. The men sitting beside her do so at more than twice that rate.
That is not what a pipeline problem looks like.
Women earn 35% of the world’s STEM degrees, a share that has barely shifted in a decade. Explanations for it divide into two. The first is upstream: too few women reach the door of a selective STEM program with the grades to get in. The second is that women who could get in are choosing something else.
Which one is doing the work is not a debating point. Studies exploiting admission cutoffs find that the field a student enters changes later earnings substantially, with the returns concentrated in the most selective programs, and that admission to those programs shapes who eventually reaches top incomes and corporate boards. If preparation is the binding constraint, the answer is remediation and access. If the constraint is choice among the already-qualified, remediation alone will not close the gap.
Why the question has been hard to settle
Separating the two requires seeing two things at once: who is eligible for a selective STEM program, and what those eligible students actually wanted.
Enrollment counts, the basis for most international comparisons, cannot do it. They record where students ended up, which folds preparation, application and the admission decision into a single number. Application data can do it. But studies with such data have mostly been stuck in one country at a time, which leaves open whether a pattern belongs to that country’s institutions or to something more general.
Why the plumbing matters
In a decentralized system a student decides where to apply, under uncertainty. Applying costs money and time, admission is a discretionary review, and a sensible applicant builds a portfolio: a few reaches, some safeties, and a quiet decision not to bother with places she expects will turn her down. Observe a gender difference in where people applied and you are observing preferences tangled up with beliefs about the odds, the cost of applying, and strategy.
A coordinated admission platform removes most of that tangle. Students submit one ranked list of program–institution combinations. Programs rank students by an academic score. A deferred-acceptance algorithm assigns and re-assigns until the match is stable, and each student lands in the highest-ranked option for which she qualifies. Eligibility is a known function of the score, not a discretionary read of an essay.
Two consequences follow. Students rank rather than choose where to apply, so putting an ambitious option on the list costs almost nothing. And under this class of mechanism, listing programs in true preference order generally leaves applicants little incentive to misreport. A submitted list is therefore a great deal closer to a preference ordering than an application portfolio has ever been.
That is what makes these platforms useful as measuring instruments. There are now enough of them to compare, and the study assembles harmonized administrative records from ten: Australia, Brazil, Chile, China, Finland, Greece, Spain, Sweden, Taiwan and Uganda.
Two gaps
Take one system and look at the top 10% of its academic performance distribution. Two facts describe the STEM applicants there. The first is who is in the room — the pipeline gap, the female-minus-male difference in representation among students above the bar. The second is what they do once there — the choice gap, the female-minus-male difference in the share who rank a STEM program first.
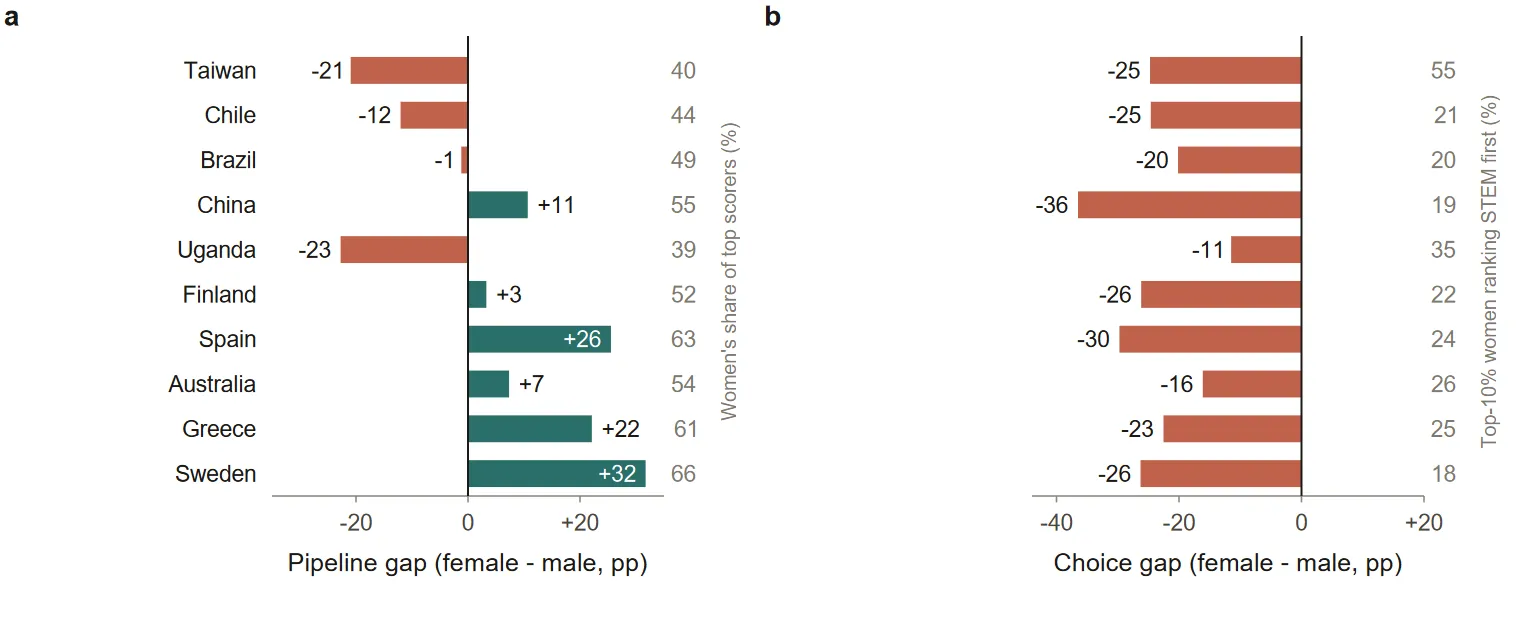
The first gap is all over the place. It runs from −23 points in Uganda to +32 in Sweden, and changes sign along the way. The second does not budge. Every one of the ten falls between −36 and −11, and not one reaches zero.
One gap travels
In Sweden, Spain and Greece women are the clear majority of top performers, and still rank STEM first far less often than the men beside them. In Uganda and Taiwan women are a minority of top performers, and the choice gap is there too. Whatever produces the pipeline gap is plainly sensitive to context. Whatever produces the choice gap is not.
Averaged across the ten settings, high-achieving women are 23.7 percentage points less likely than high-achieving men to rank a STEM program first. Pooling students rather than settings gives 22.4 points. In eight of the ten systems the gap exceeds 20 points.
It also survives every obvious attempt to break it. Widen the definition of high achievement six-fold, from the top 5% to the top 30%, and the pooled gap moves by less than a single percentage point. Count a STEM program anywhere on the list rather than only first, and it holds everywhere. Line the ten settings up by gender parity in wages — a proxy for norms in the domain closest to specialization decisions — and the two gaps part company: the pipeline gap narrows and can turn positive, while the choice gap barely responds, staying large and negative in the most gender-equal countries in the sample.
Which leads to the number worth putting in front of a ministry. Close the pipeline gap completely, leave application behavior where it is, and the pool of high-achieving STEM applicants would still be between 57% and 75% male — in every one of the ten settings. Fixing preparation is worth doing on its own terms. It would not, by itself, produce a gender-balanced applicant pool anywhere in this sample.

"The stability of the STEM choice gap across contexts with vastly different levels of income, human development and gender parity highlights the need to carefully identify and disentangle persistent mechanisms that are shaping girls' education choices, and which appear to be operating globally."
What it does not prove
A similar-sized gap in ten different places is not evidence of a fixed or innate difference in what women want. Choices are formed inside social, cultural and institutional environments, and gaps of similar size can be produced by quite different combinations of forces in different places.
Nor does the study identify a mechanism. The admission rules let it set most of the strategic story aside, but administrative records do not reveal the beliefs behind a ranking. Different information about what STEM study and work involve, different expected returns, less search before applying, anticipated discrimination, identity and belonging: all remain live candidates, and the paper sets out what evidence would separate them. The decomposition is descriptive. It allocates an observed gap between two margins; it does not estimate the effect of any intervention.
The instrument
Centralized admission systems are usually discussed as allocation machinery. They make admissions fairer, cheaper and harder to game, which is reason enough to build them.
But a system that asks every student to write down a ranked list, and that removes most of the reasons to write down anything other than what she wants, is also producing a national record of intentions — something otherwise extraordinarily hard to obtain. Ten of them, harmonized, were enough to show that the STEM gender gap in applications is not principally a story about preparation. The same records are where an information or guidance intervention would have to be measured, because they capture the decision at the moment it is made rather than years later at graduation.
Ten countries, five continents, a six-fold change in who counts as a high achiever: the pipeline gap moves with all of it. The choice gap barely notices. Whatever is keeping high-achieving women out of STEM, it is not, mainly, that nobody taught them the mathematics.
This post is part of the ConsiliumBots working paper series. Per-country profiles, the full decomposition, an interactive threshold explorer and every figure with its underlying counts are available at gendergapinsights.com.